Debugging Cargo Test
While developing some crates in rust, I ran into a few crashes in certain situations when using these crates from another application. In order to more easily reproduce the problem, and also minimize or eliminate future regressions, I decided to write some unit tests for these issues, and use them to more easily debug the problems… or so I thought!
Writing the test itself was fairly trivial, and there are plenty of examples and documentation for how rust unit testing is done.
#[test]
fn change_binding_numbers() {
    let ps_data = include_bytes!("./ImGuiPs.spirv");
    let mut module = ShaderModule::load_u8_data(ps_data).unwrap();
    let descriptor_sets = module.enumerate_descriptor_sets(None).unwrap();

    assert_eq!(descriptor_sets.len(), 1);
    let descriptor_set = &descriptor_sets[0];

    assert_eq!(descriptor_set.bindings.len(), 2);

    let tex_descriptor = &descriptor_set.bindings[0];
    module.change_descriptor_binding_numbers(&tex_descriptor, 30, Some(1)).unwrap();
}
Things took an interesting turn when I ran cargo test (expecting a crash) and my new test wasn’t listed in the output, though the test execution clearly failed.
Graham@GrahamPC MINGW64 /h/Repositories/spirv-reflect-rs (master)
$ cargo test
    Finished dev [unoptimized + debuginfo] target(s) in 2.65s
     Running target\debug\deps\mod-7fc6036a53e444d0.exe

running 4 tests
test tests::load_module ... ok
test tests::enumerate_bindings ... ok
test tests::enumerate_sets ... ok
error: test failed, to rerun pass '--test mod'
Using tried and true printf debugging, I changed the test to write out however far the execution got before crashing.
#[test]
fn change_binding_numbers() {
    println!("HERE - 1");
    let ps_data = include_bytes!("./ImGuiPs.spirv");
    let mut module = ShaderModule::load_u8_data(ps_data).unwrap();
    let descriptor_sets = module.enumerate_descriptor_sets(None).unwrap();

    assert_eq!(descriptor_sets.len(), 1);
    let descriptor_set = &descriptor_sets[0];

    assert_eq!(descriptor_set.bindings.len(), 2);

    println!("HERE - 2");
    let tex_descriptor = &descriptor_set.bindings[0];
    module.change_descriptor_binding_numbers(&tex_descriptor, 30, Some(1)).unwrap();

    println!("HERE - 3");
}
Running the test again, the same results were printed out, even though HERE - 1 should at least be displayed.
Graham@GrahamPC MINGW64 /h/Repositories/spirv-reflect-rs (master)
$ cargo test
    Finished dev [unoptimized + debuginfo] target(s) in 2.65s
     Running target\debug\deps\mod-7fc6036a53e444d0.exe

running 4 tests
test tests::load_module ... ok
test tests::enumerate_bindings ... ok
test tests::enumerate_sets ... ok
error: test failed, to rerun pass '--test mod'
After some documentation searching, the --nocapture flag was discovered which disables the logging silence.
Graham@GrahamPC MINGW64 /h/Repositories/spirv-reflect-rs (master)
$ cargo test -- --nocapture
    Finished dev [unoptimized + debuginfo] target(s) in 0.31s
     Running target\debug\deps\mod-7fc6036a53e444d0.exe

running 4 tests
HERE - 1
HERE - 2
HERE - 3
test tests::enumerate_sets ... ok
test tests::enumerate_bindings ... ok
test tests::load_module ... ok
error: test failed, to rerun pass '--test mod'
Hmm, it reached the end? Based on prior experience with writing FFI layers, especially around custom Drop trait implementations, I added an additional logging statement on a hunch.
impl Drop for ShaderModule {
    fn drop(&mut self) {
        println!("Called drop for ShaderModule");
        if let Some(mut module) = self.module {
            unsafe {
                ffi::spvReflectDestroyShaderModule(&mut module);
            }
        }
    }
}
Graham@GrahamPC MINGW64 /h/Repositories/spirv-reflect-rs (master)
$ cargo test -- --nocapture
    Finished dev [unoptimized + debuginfo] target(s) in 0.31s
     Running target\debug\deps\mod-7fc6036a53e444d0.exe

running 4 tests
HERE - 1
Called drop for ShaderModule
Called drop for ShaderModule
HERE - 2
HERE - 3
Called drop for ShaderModule
Called drop for ShaderModule
test tests::enumerate_sets ... ok
test tests::enumerate_bindings ... ok
test tests::load_module ... ok
error: test failed, to rerun pass '--test mod'
Now the drop is being printed out, but all the tests are spamming. Rust unit tests are evaluated in parallel, which can make debugging somewhat confusing. As hinted at by the error message, another useful cargo test flag is --test mod, which allows for excluding all tests from execution except for the specified name.
In this example, --test change_binding_numbers accomplishes what we want.
Graham@GrahamPC MINGW64 /h/Repositories/spirv-reflect-rs (master)
$ cargo test -- --nocapture --test change_binding_numbers
    Finished dev [unoptimized + debuginfo] target(s) in 0.32s
     Running target\debug\deps\mod-7fc6036a53e444d0.exe

running 1 test
HERE - 1
HERE - 2
HERE - 3
Called drop for ShaderModule
error: test failed, to rerun pass '--test mod'
Aha, clearly something bad is happening when ShaderModule goes out of scope!
But now what? The nature of the rust language means that debugging memory related crashes is very rare, but working with unsafe code or FFI layers still brings you the odd fun surprise. When running cargo test, the log output shows the running executable - the above example prints out Running target\debug\deps\mod-7fc6036a53e444d0.exe
The test executables can be run outside of cargo test, which simplifies some of the debugging.
Graham@GrahamPC MINGW64 /h/Repositories/spirv-reflect-rs (master)
$ target/debug/deps/mod-7fc6036a53e444d0.exe --nocapture --test change_binding_numbers

running 1 test
HERE - 1
HERE - 2
HERE - 3
Called drop for ShaderModule
With this knowledge, we can use VSCode for debugging - see my previous post for more details on this.
The test executable can be specified in .vscode/launch.json
{
    "version": "0.2.0",
    "configurations": [
        {
            "name": "(Windows) Launch",
            "type": "cppvsdbg",
            "request": "launch",
            "program": "${workspaceFolder}/target/debug/deps/mod-7fc6036a53e444d0.exe",
            "args": ["--nocapture"],
            "stopAtEntry": false,
            "cwd": "${workspaceFolder}",
            "environment": [],
            "externalConsole": true
        }
    ]
}
Launching the VSCode debugger correctly reproduces the unit test crash - clearly a problem of garbage memory…
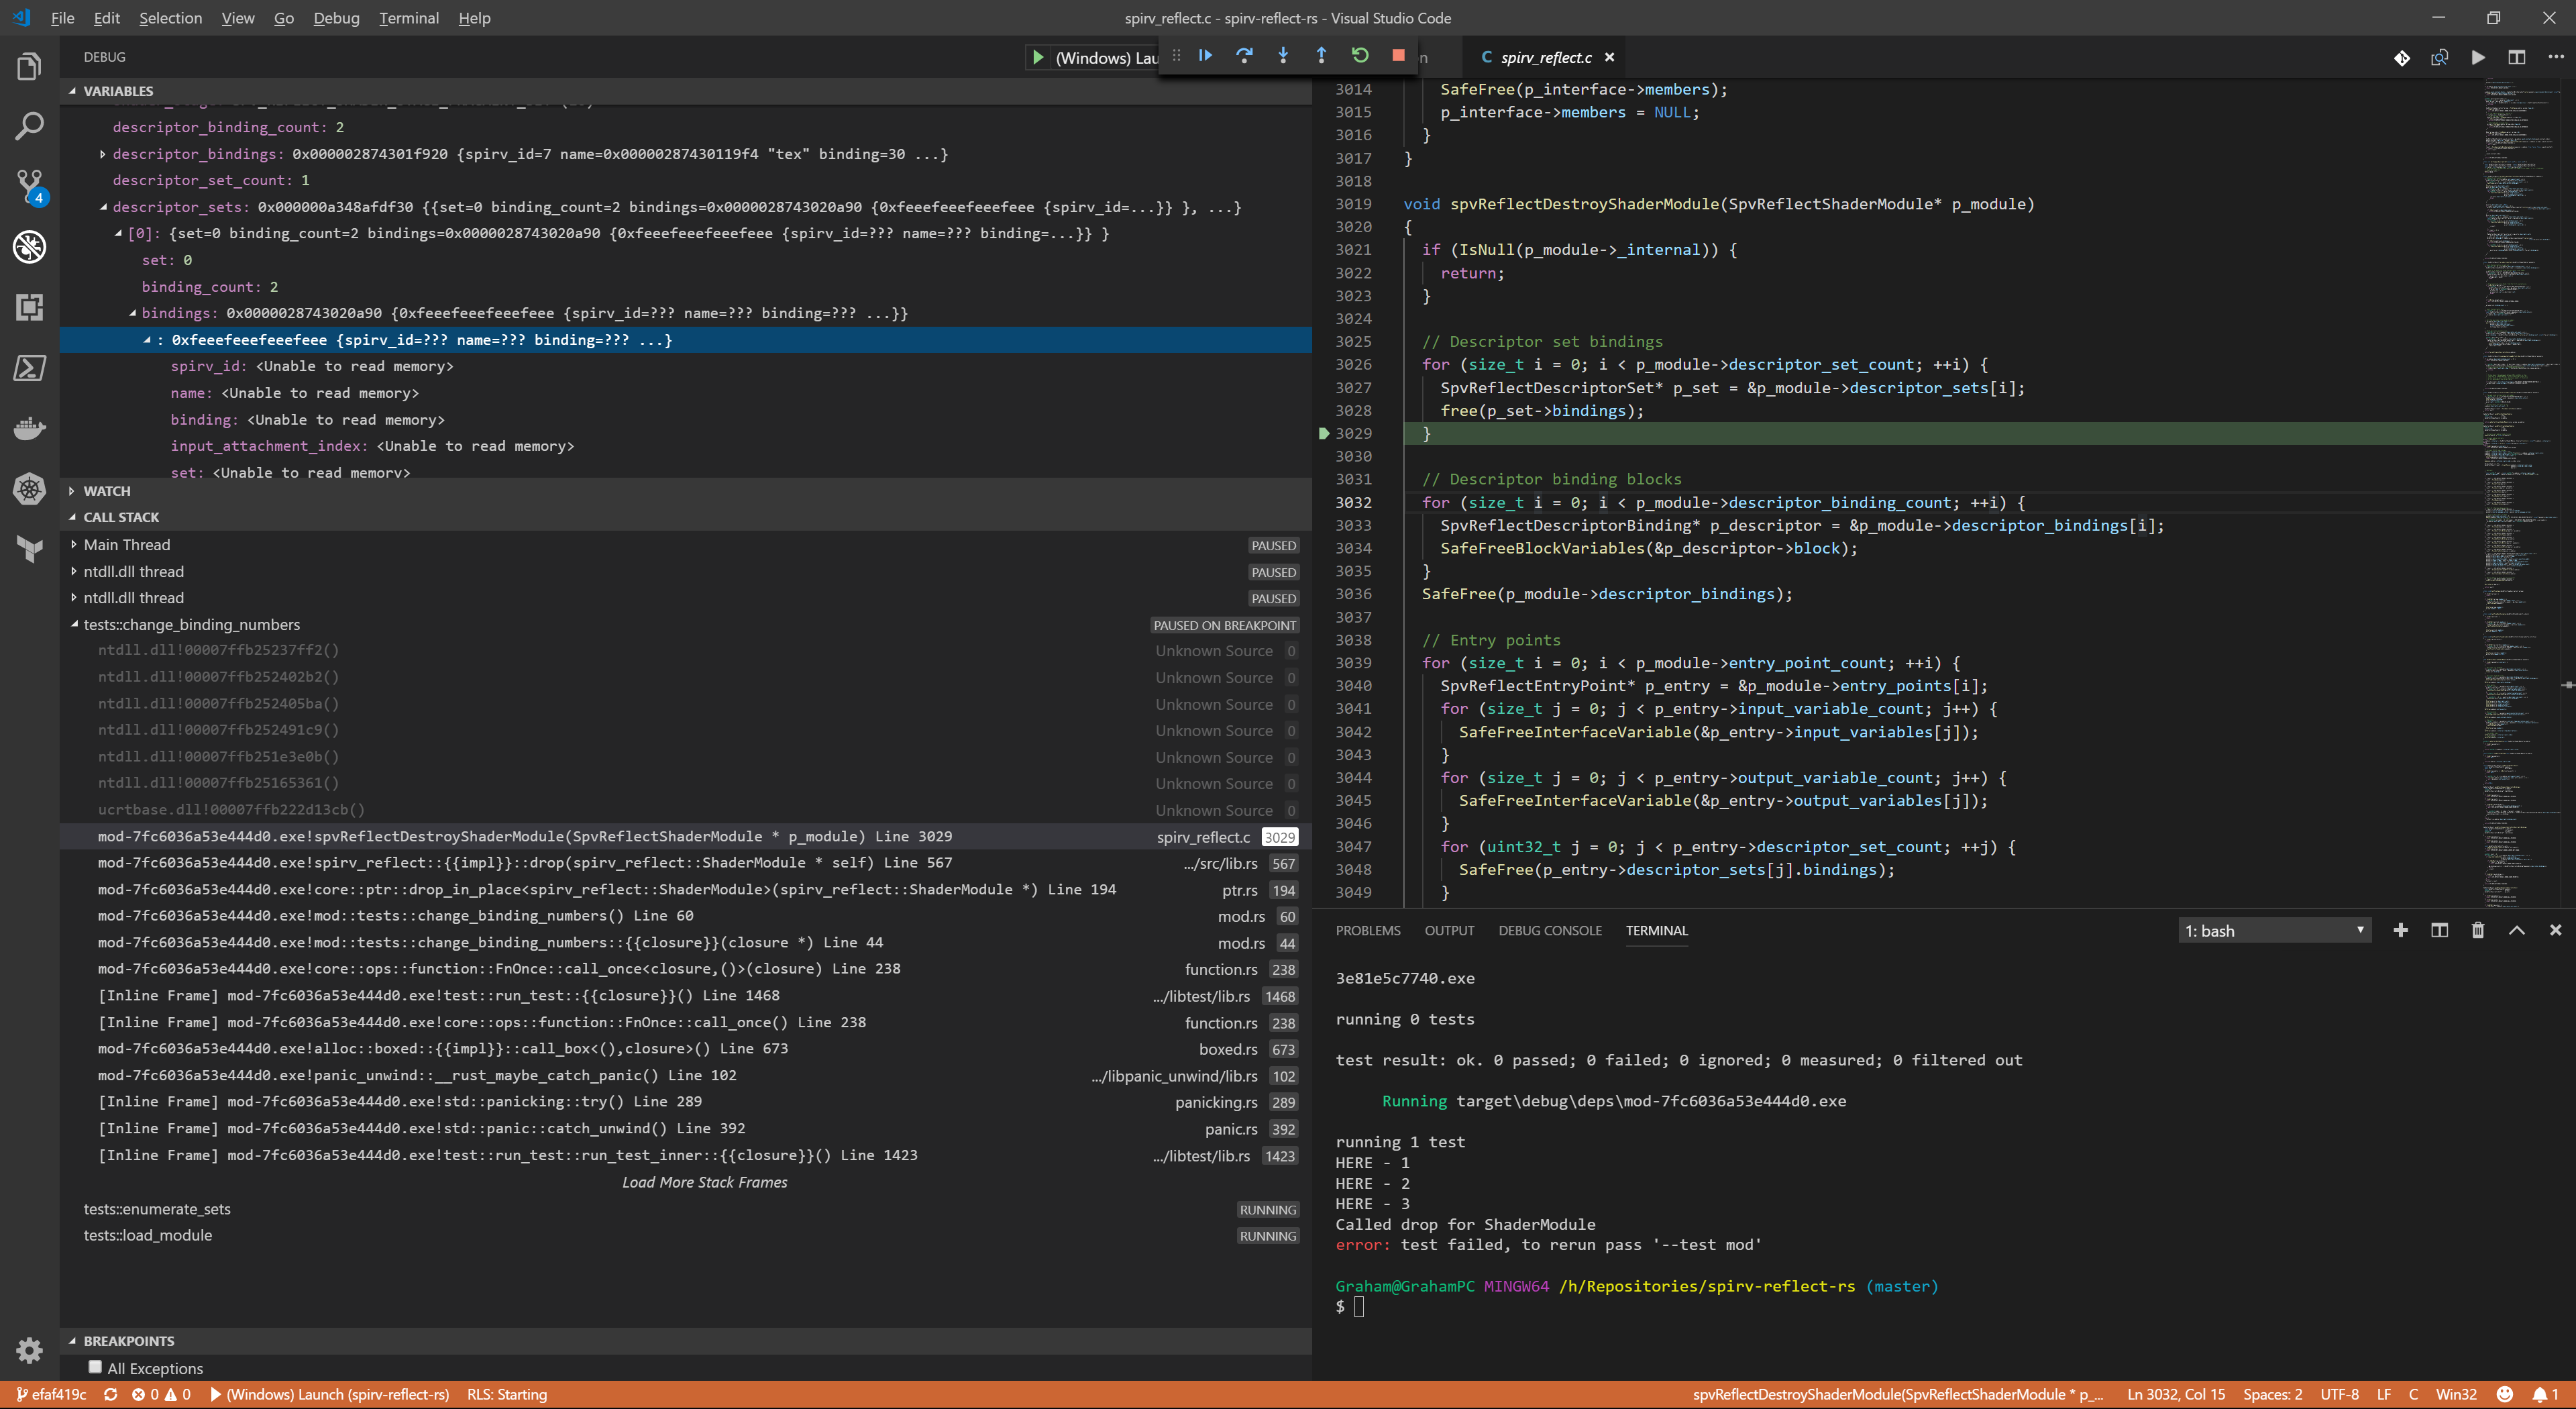
Debugging basic issues in VSCode is fine, but for anything more complicated it leaves a lot to be desired.
Sigh, I guess I’ll load up Visual Studio… =)
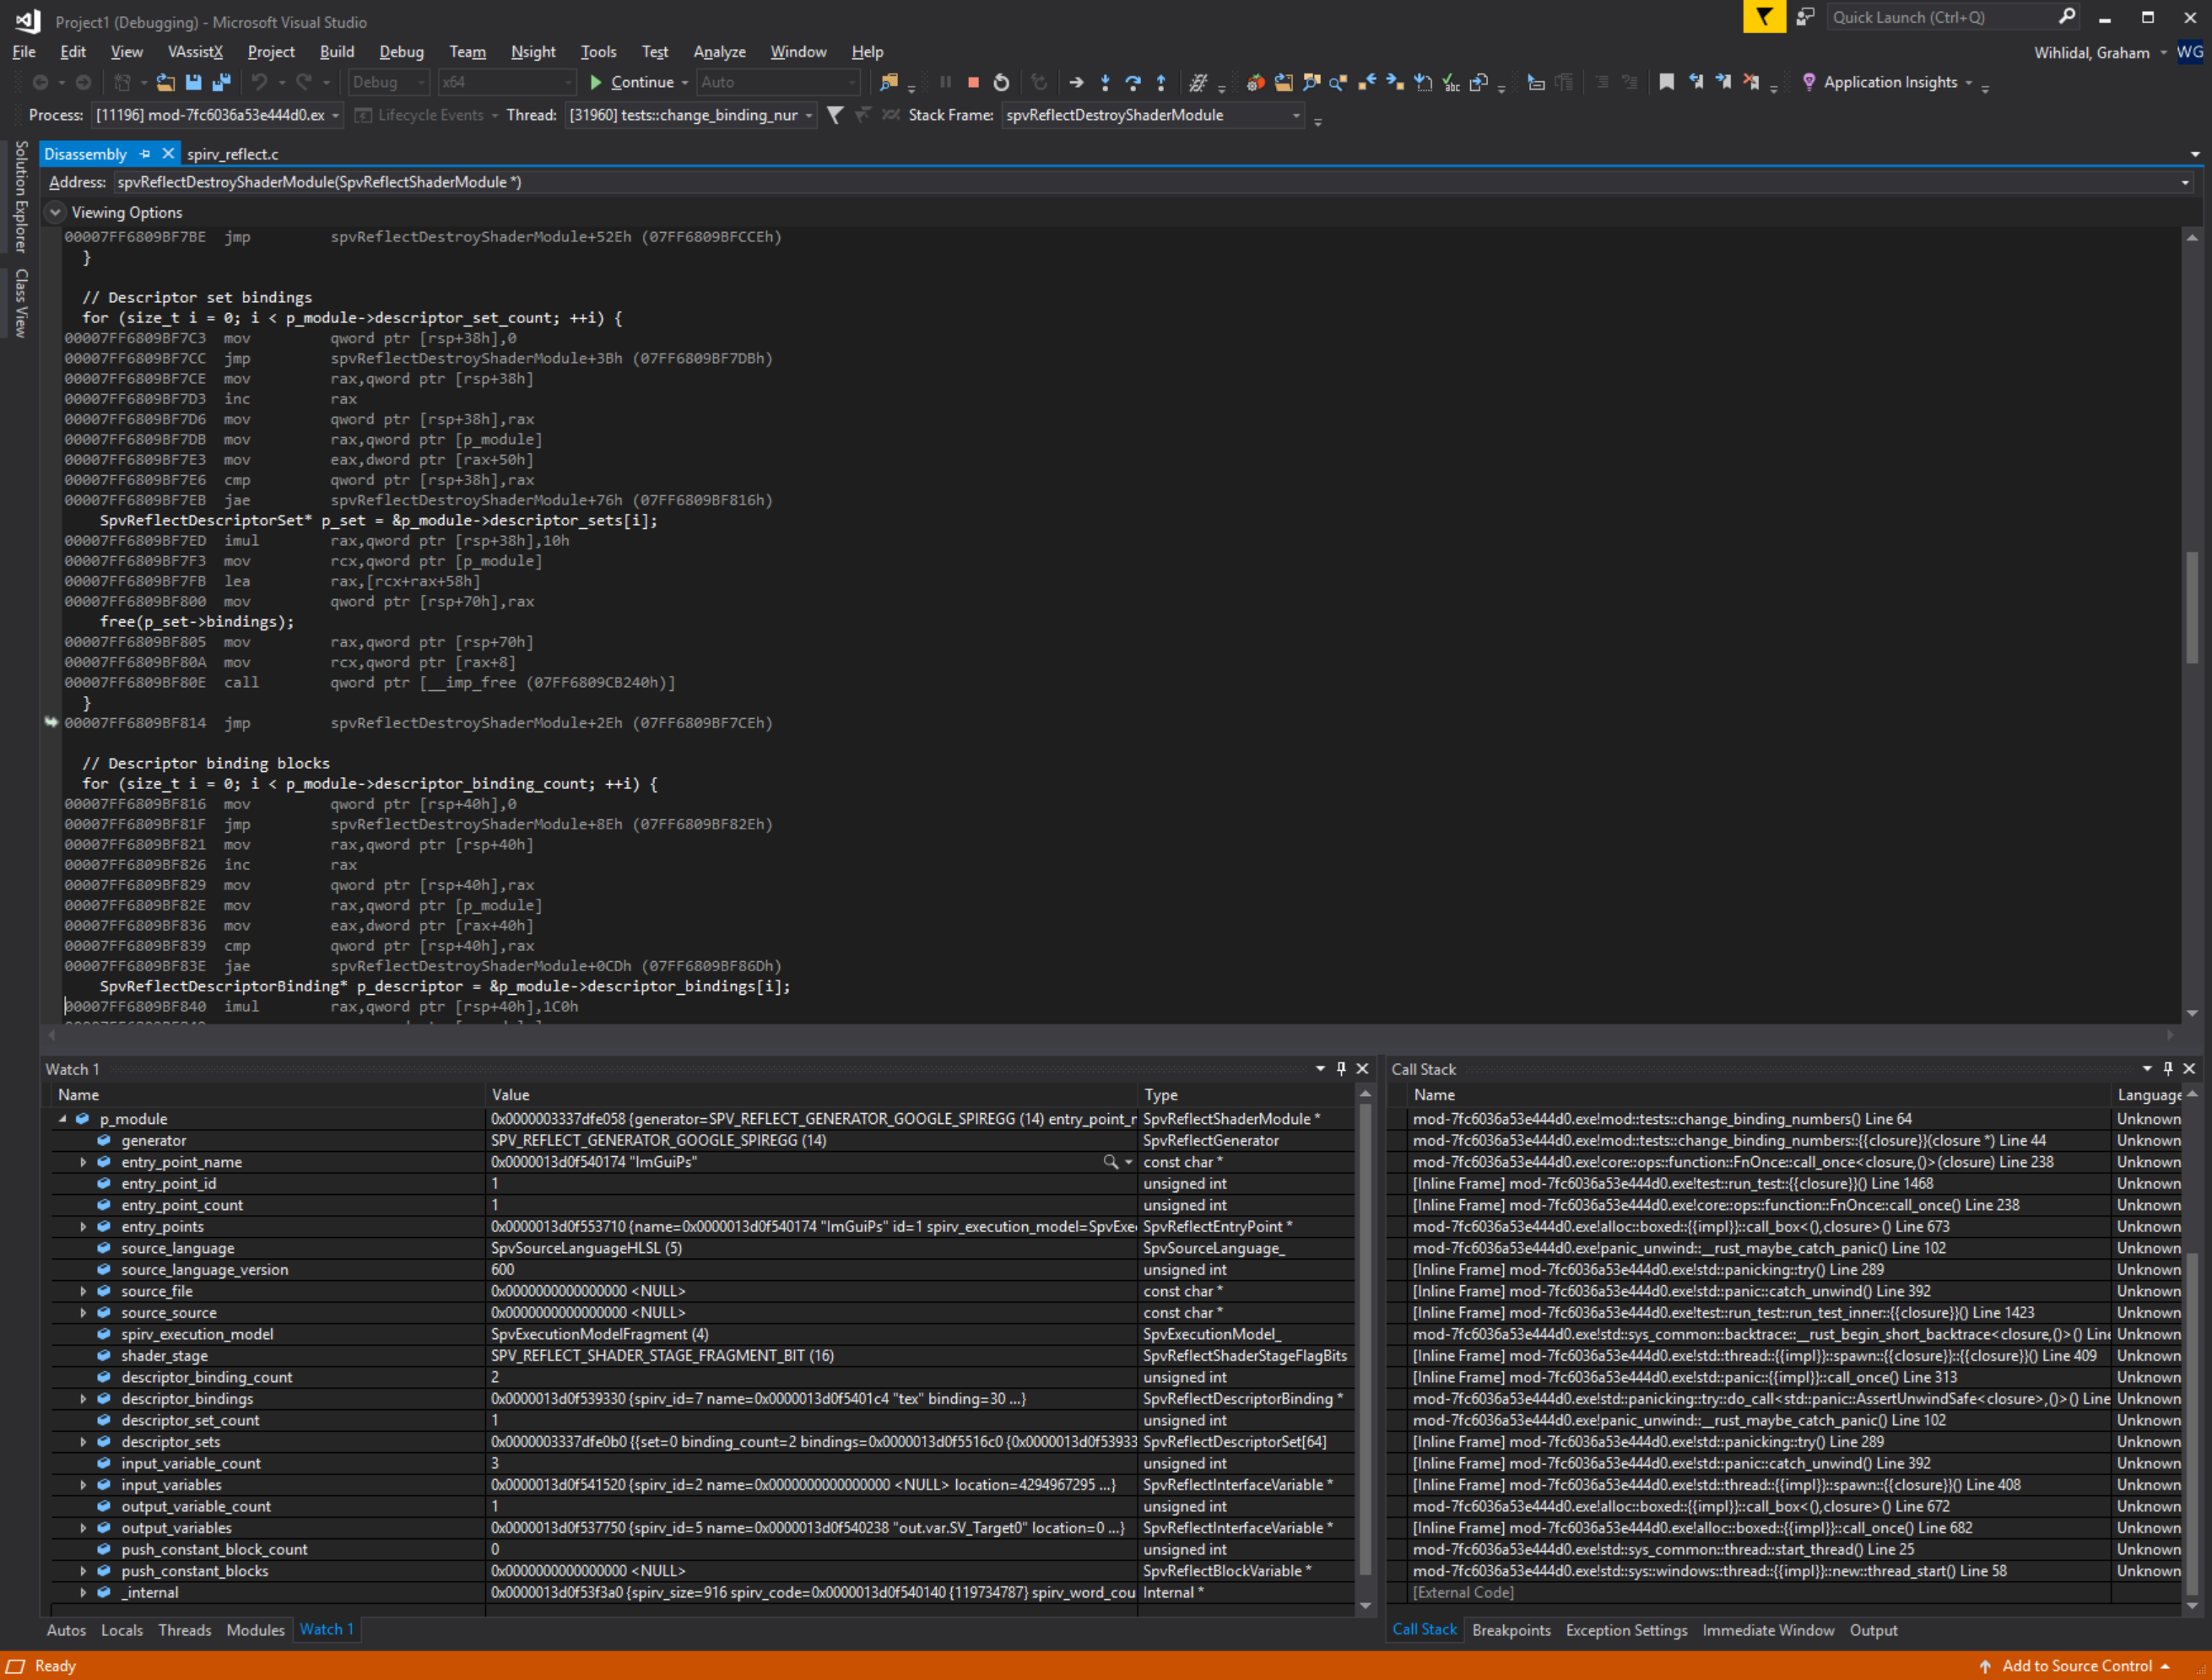
With an empty solution and project, configure the debugging properties like the following image.
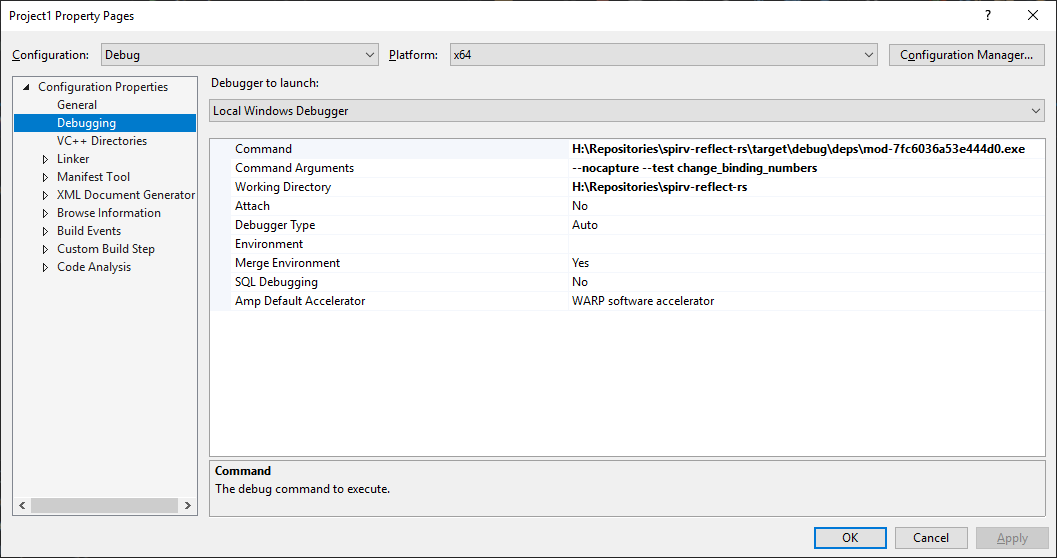
Now you can launch the debugger as normal, and regret ever straying from pure rust code!
Hope this helps someone - enjoy!